EarlyLayers 2-9
Modality separation. Expert selection differed by modality.
Early expert selection differs by modality. Cross-modal output transfer becomes clear between decoder layers 31 and 32.
The router assigns each token to six experts. Here, modality means speech, image, or text. We compare the expert IDs across modalities.
In layers 2 to 9, the selected IDs differ by modality. Between layers 10 and 34, the lists become more similar. After layer 35, the router often selects similar lists for all three modalities.
Changing the early expert groups increases loss for every task. Output swaps locate another transition between layers 31 and 32.
At layer 32, matching-transcript routed outputs transfer better than geometry-matched different transcripts.
This shows cross-modal functional compatibility. It does not show full modality independence.
Inkling-Small has one decoder for all three modalities. It has no separate vision or audio Transformer.
The router assigns each token to six of 256 experts. An expert is a small processing block inside the decoder.
We provided the same sentence as speech, a rendered image, and text.
We recorded expert selection and expert outputs at each decoder layer. We changed expert groups and swapped outputs at six selected layers.
These measurements separate expert addresses, output vectors, and effects on prediction loss.
Select text, image, or audio. Then select one token. The chart lists the six selected experts at four layers.
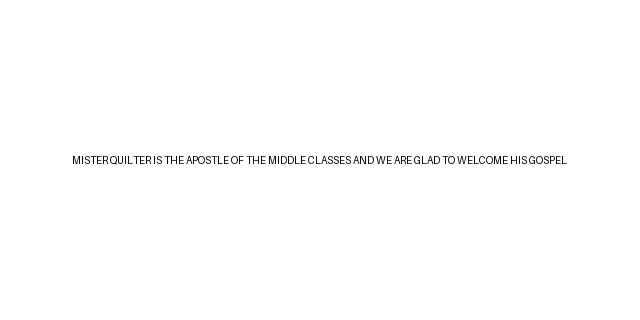
MISTER QUILTER IS THE APOSTLE OF THE MIDDLE CLASSES AND WE ARE GLAD TO WELCOME HIS GOSPEL
A left mark indicates a leading space.
The experiment rendered this transcript at 640 by 320 pixels.
Evenly sampled across the image-token sequence
Sampled across 5.855 seconds.
Read from top to bottom. Each block is one selected expert. Block width represents routing weight.
For this token, E3 has the highest weight at layer 2. E163 has the highest weight at layer 41. No expert ID repeats between consecutive shown layers.
The six saved weights add to 100% in each row. Color identifies the expert ID.
We tested 18 transcripts. Expert selection differed by modality in layers 2 to 9.
In layers 10 to 34, matching transcripts produced more similar expert lists.
After layer 35, the same expert groups often received tokens from all three modalities.
This pattern is consistent with a transition from modality-specific processing to cross-modal content processing. Expert outputs test whether the late computation also aligns.
Each modality produces a 256-number profile at each layer. A score of 0 means different profiles. A score of 1 means identical profiles.
Six transcripts identified the expert groups. Twelve different transcripts tested each change.
Modality separation. Expert selection differed by modality.
Matching transcripts. Expert lists were more similar for inputs with the same transcript.
Similar lists. Expert lists were often similar across modalities.
Route similarity alone does not establish causal importance. We blocked each group and measured the change.
We also swapped early groups between speech, image, and text.
The control condition changed other experts with similar overall use.
“Worse” marks a clear loss. “No clear change” includes small or uncertain differences.
| Task | Early | Middle | Late |
|---|---|---|---|
| Read speech | Worse | No clear change | No clear change |
| Read image text | Worse | No clear change | No clear change |
| Predict text | Worse | Worse | No clear change |
This score measures whether two inputs contain the same words. Higher values indicate better retrieval. The control value did not decrease.
In four generated examples, speech word error rose from 4.8% to 10.0%. Image-text character error rose from 0% to 4.7%.
This scale difference explains the weak late ablation. Removing most routed weight changed only a small part of the layer update. #
The swap replaced outputs at layers 21, 31, 32, 33, 36, and 41. The controls used another transcript or an equal-norm random vector. #
Input tokens, attention, router decisions, and every other layer output stayed unchanged. #
A result is conclusive when both 95% control-minus-matching intervals are above zero. #
| Replaced output | Different transcript | Random direction |
|---|---|---|
| Two shared experts | +0.0318[+0.0003, +0.0763] | +0.0362[+0.0017, +0.0783] |
| Six routed experts | +0.0058[+0.0037, +0.0078] | +0.0028[-0.0005, +0.0060] |
Values show extra prediction loss relative to a matching cross-modal swap. Positive values mean that the matching swap caused less loss. Brackets show 95% intervals across eight transcripts. #
We searched 73 transcripts for different-transcript donors with similar hidden states and routing profiles. The matched test used 166 token rows from 13 transcripts. #
The mean hidden-similarity difference was -0.0072. The mean routing-profile difference was +0.0040. We selected the rows before we measured prediction loss. #
| Replaced output | Different transcript minus matching transcript | 95% interval |
|---|---|---|
| Six routed experts | +0.0307 | [+0.0077, +0.0580] |
| Two shared experts | +0.0255 | [-0.0005, +0.0555] |
The routed interval is above zero. A matching transcript supplies a more useful routed output than a geometry-matched different transcript. This shows cross-modal functional compatibility at layer 32. #
This result does not show full modality independence. The outputs can retain modality information that this test does not measure. #
Router similarity alone does not prove expert specialization. Wang, Hayou, and Nalisnick (2026) show that similar routing can follow hidden-state geometry rather than domain-specific expert functions. #
Xi Wang, Soufiane Hayou, and Eric Nalisnick. “The Myth of Expert Specialization in MoEs: Why Routing Reflects Geometry, Not Necessarily Domain Expertise.” arXiv:2604.09780, 2026. #
Expert selection differed by modality in layers 2 to 9. Blocking these groups increased loss for every task.
Expert lists for matching transcripts became more similar in layers 10 to 34. Changes in this range increased only text-prediction loss.
At layer 31, only one control interval excluded zero for each output component. Both routed-output intervals excluded zero at layer 32.
Both shared-output intervals excluded zero at layer 33. The same criterion held for one component at layers 36 and 41.
Every tested depth from layer 32 onward met the criterion. The output component differed by depth.
At layer 32, the routed-output result remains clear after matching hidden-state direction and routing profile.
The late computation contains a shared transcript signal. It can still contain modality information.